DataViz – US Census Data (10/18/2010)
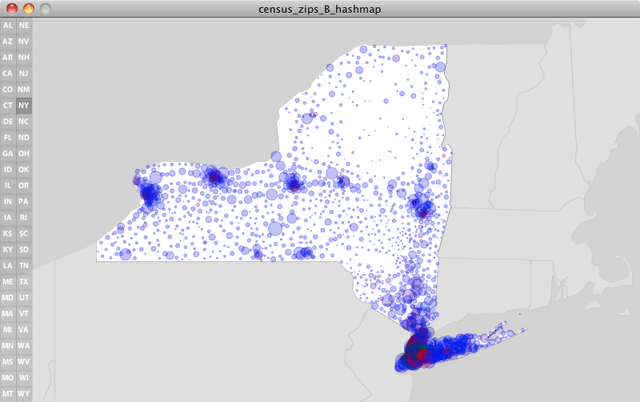
NY State Census Data

NY State Census Data

This week I tackled a much larger, and much more complex data set: the US Census data on population size, ethnicity, and family income. Much of my time has been in strategizing a data structure and getting my data into these hashmaps, arraylists, and objects. Next I worked on setting up vector maps of each state for the backdrop of the data, as well as programming a user-interface that allows users to pan and zoom the map, while also isolating data for each state.

The sketch in its current form is still very much a work in progress. My next steps are to store position and zoom details for each state to allow users to focus on individual locations, as well as to devise a way to visualize a region’s distribution of wealth as a series of concentric circles. Additionally, I’d like their to be pop-up windows that float in to give text-based info on whatever point your mouse is over. Likely this will turn into a midterm project, as tens of hours will be needed to resolve all this coding.

Link to the LIVE PROCESSING SKETCH. (note, the total filesize is 6.6MB, so please be patient as the sketch folder downloads).

Mobile Media Midterm: Qoords (10/12/2010)

For the midterm, I went forward with my location-tracking application. One of my goals was to make the application usable on an iPhone in the Safari browser app. The below screen shots were taken off my iPhone, illustrating some of the app’s functionality.

photo

The app is iPhone friendly with large buttons and full-res imagery.

photo-1

Its easy to find your location and save it to the database.

photo-2

You can see all the saved locations and load them to the map.

The Concept

The Concept is to create an browser-based application for easily storing your location and accessing your stored entries. The finished app would have unique users, allowing an opportunity for people to search, share, and collaborate with one another’s data. In this initial execution, there is only a single default user, so all stored locations are put into the same place.

The Technical Details

This app utilizes PHP, Javascript, HTML, and SQL to function. I’ve made use of the Google Maps API for javascript for most of the front-end functionality, such as finding a location, inputting an existing location, and dragging around the location markers to adjust the positions.

Once a position is determined, it can get stored in the database using a simple form for creating a name. Then in the ‘list’ view these stored entries are listed and can be clicked on to load them on the map.

Much of the development of the app went into fine tuning this very functionality.

Next Steps

The next step is to make a user table in the database and allow users to login to the site. Once you are logged in as a unique user, you could have your own unique location data to add to and read back from. And once their are multiple users in the community, there would be the ability to connect to one another and choose whether your locations are shared publicly, among your connected peers, or not at all.

The whole concept for this app initially came from the desire to track a food truck, so I’d also like the ability to have users upload their own images to use as a marker on the map, instead of the default marker.

In general, there are numerous ways to expand upon this concept and build a great, usable app. I see this midterm assignment as a great kickoff point, and now need to plug 100 more hours into the coding to really push this application further.

Mobile Media Midterm Proposal (10/05/2010)

I’m super interested in working with location-based services and the google maps API to build an browser-based mobile app for iPhone and Android. Last week at my internship at The Barbarian Group, a bunch of us got lunch together from this mobile food truck that is a local favorite. The truck is seldom there, so when it gets spotted, there’s a surge of interest and a group gets organized to head over together.

It dawned on me that there should be a simple way for the food trucks of NYC to be able to easily post their locations to a centralized place where potential customers can look them up and track them down. So my original idea was to simply allow food truck workers to log into a website, post their location, and go on with selling their food. But next it occurred to me that a lot of people could take advantage of this service. Now that our society and culture has dramatically changed and we are all ‘on-the-go’ a large percentage of our time, it makes increasing sense to be able to post your actual location to the people you want to have find you.

Foursquare does a good job of putting geo-tagging location technology at our fingertips, but at its core, Foursquare is a game about earning points, being cool/exclusive, and winning Mayor titles/badges as a reward for your on-the-go activities. But the very notion of ‘checking-in’ is temporary. To check in to a coffee shop could mean that you stopped in briefly, or that you even just passed by it. But what if you plan to set up your computer and work there all afternoon? And what if you want your colleagues, friends, and family to know you’re there so they can stop in and visit you? Or better yet, what if you are moving back and forth between your two offices, two apartments, three client offices, and five errands, and you’d like your spouse to come and find you when they get out of work?

For both food trucks and regular people, I want to make finding one another and broadcasting your coordinates much simpler. So I’d like to build a web-based service called Qoords to help do this.
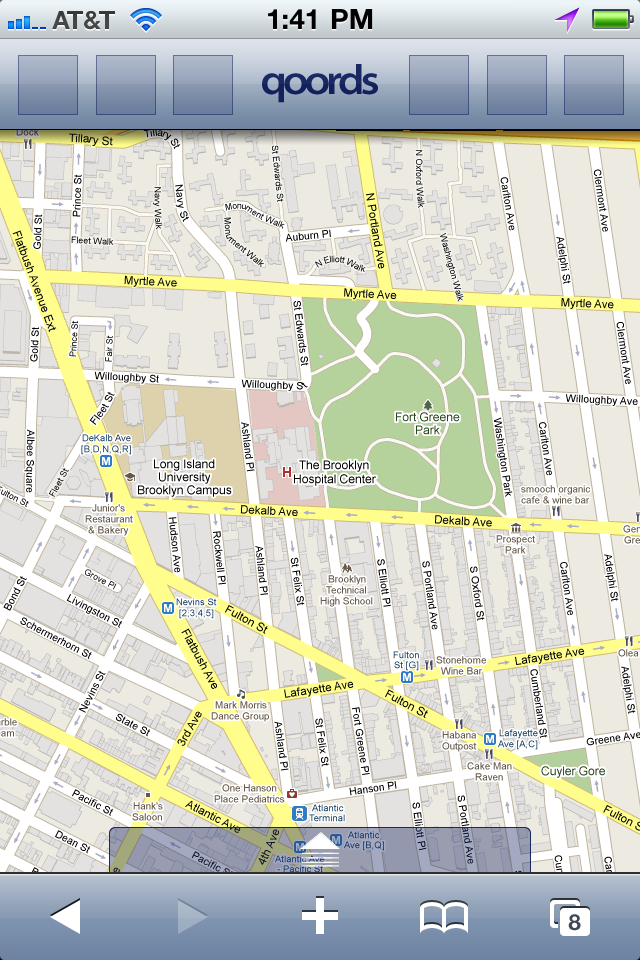
sample screen (in progress)

sample screen (in progress)

At the core of the app is the location-grabbing script that we learned about last week. Linking it with the google maps API gives you a nice moveable map at your fingertips. Some of the key functionality of the service would be:

1. Post my coordinates
2. Show a list of my past posts
3. Show a business/friend’s location
4. Add a business/friend to follow
5. What’s hot?
6. Search for businesses, friends

On the backend, there would be a database storing longitude and latitude coordinates, a user id, and a timestamp with each post. There would be a second table storing the friends and businesses you are linked to, electing to share your information. Probably there would be two types of publishing (everyone, versus select circle only). All of the functionality would simply be inserting, updating, and extracting info from the db and displaying it to the onscreen map.

The app would be free and open to all platforms, as it would accessed through a web browser, rather than from a dedicated app. Tailoring it to be optimized for various screen sizes would be as simple as having a few separate style sheets.

Obviously building this whole concept is a pretty large undertaking. So for the midterm, I need to strategize what core functionality I would be tackling first, given there is only two weeks time to pull it all off. There are numerous existing services that this concept overlaps with, so I hope to borrow a lot of ideas, rather than reinventing the wheel.
Data Parsing with Processing – Part 2 (10/03/2010)


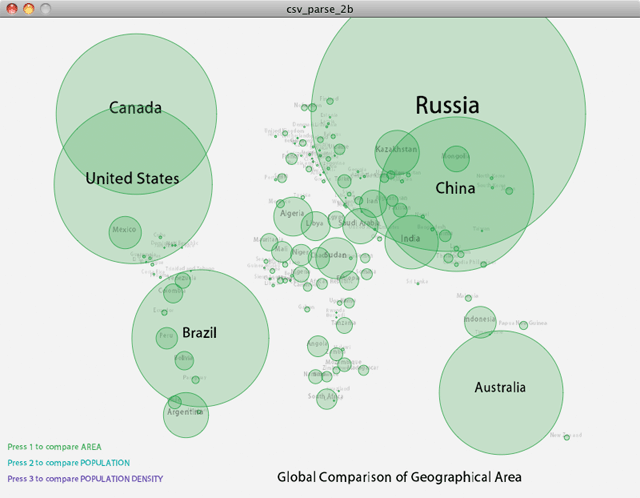
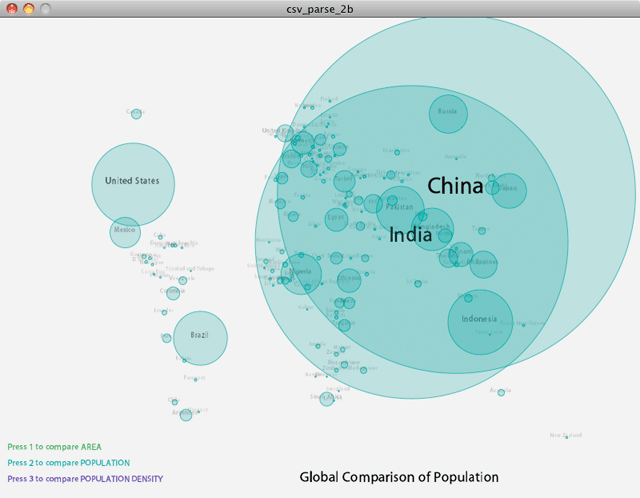
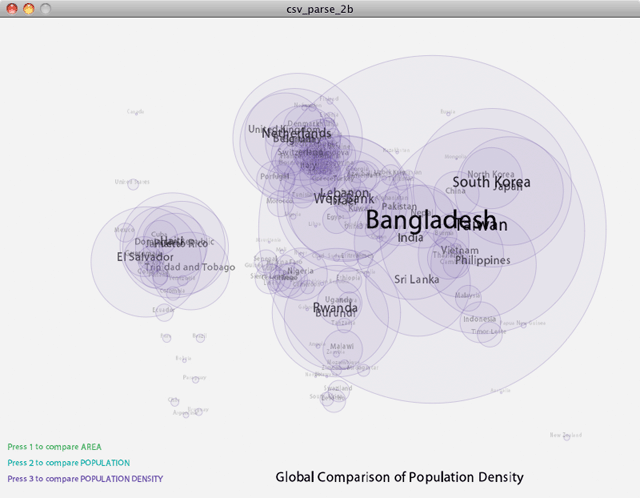
Using the CIA’s World Fact Book as a data source, I’ve created a comparative visualization of global population density.  Using the keyboard’s number keys, a user can toggle between seeing a global comparison of area, population, or population density.

World Fact Book data was provided to me as a SQL database, which I exported to CSV and groomed for visualization.  First I filtered out all countries with less than 1M residents, and next I filtered out anomolies such as Gaza and Hong Kong, as they are technically single city nations that have unusually high density and were subsequently skewing my graphics.

Processing was employed to parse the data, load it into objects, and display the objects as colored circles on-screen.  My next step will be to incorporate life expectancy and other quality-of-life factors to see if there is a correlation with population density.

Link to Source Code.  Link to LIVE PROCESSING SKETCH.

ITP411 Launches! (9/28/2010)
Posted in Uncategorized

Katherine Keane and I launched ITP 411 last night!

So far more than 25 have registered, and we hope to see that number climb over 100.  There are about 230 or so students at ITP, so it would be great to have an adoption rate of 50%.  A lot of people don’t carefully read the list, so perhaps a timely email from Midori could help out here.

In order to launch, we did some extensive testing and added a great deal of functionality to our code.  To name a few improvements:

1. If you send a blank text, you get instructions back.

2. If you try to search before adding your own name, you get an error, telling you that searching is only open to members.

3 If you try to update your name, but your name does not already exist, your name will be entered as a new entry.

4. Formatting of phone numbers has been optimized for Android and iPhone so that you can simply click search results to dial.

5. The database keeps track of how many searches you have made, and how many times you have been searched for.

We look forward to people using this new service and giving us feedback on what to improve.

Data Parsing with Processing – Part 1 (9/27/2010)

dViz_screen

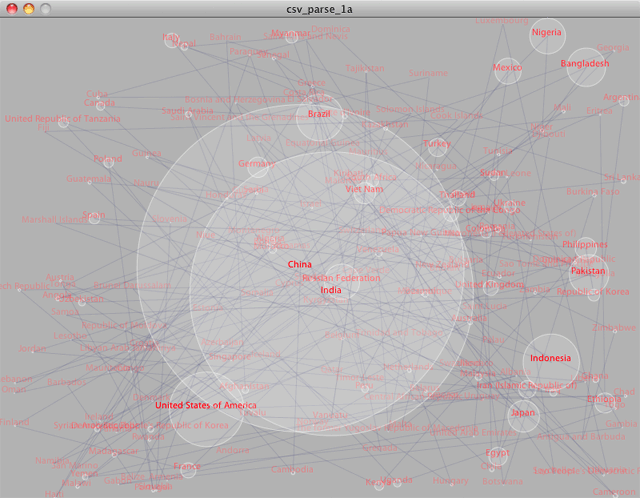
For the week 2 assignment in Expression Frameworks, I’ve taken the population of all the world’s countries and plugged it into a Processing sketch.

First, the comma-seperated-value data file was split into lines; next, the individual values for country name and population amount were extracted; and finally these values were stored into Objects for display and manipulation.

My Processing coding is a little rusty, so I thought I’d visualize each country as a bouncing ball, where the diameter was related to the population size.  In a loosely haphazard way, the balls bounce to and fro and are interconnected with lines.  I’d love for the visual variables to directly correlate with the data variables and for there to be additional cross-referencing data values (like GDP, etc), so I’m looking forward to developing this further into a true data visualization.

For now, I’m feeling more comfortable with my Processing syntax and getting even more excited about this class.

Link to the Data Source.  Link to the Code.  Link to the Live Processing Sketch.

Mobile Media – Text based phonebook (9/21/2010)

phone_imagephone_image2

The challenge in thinking up ideas for SMS based applications is that many applications would simply work better via the web or a mobile device.  Why use text?  Are there any ideas where being SMS based is a necessity or a strength, versus an inconvenience.  Most of the SMS based apps out there that seem to work fall into one of two categories:

1. They app is intended to collect money, via your phone bill (like donating to the victims of the Haiti earthquake)

2. The app is intended for fledgling nations that use SMS rather than web-browsing

Katherine Keane and I sought out to create an app for the ITP community, and we didn’t want to take anyone’s money, nor did we want people to stop using web browsers when appropriate.

There has been a need in the ITP community for a centralized phonebook which lists students’ phone numbers.  Recently a post to the email list invited people to add their name to a public google spreadsheet with this same intent.  However, very few people elected to participate.  One reason why is that the information on a spreadsheet is extremely accessible.  Its just as easy to look up one number as it would be copy all the numbers.  So some people are apprehensive about putting their name into such an open-book format.

Kat and I devised a plan to put this same info into an app that you can text to search for names.  Because of the cost and time that it takes to lookup a single number, it is very unlikely that someone would take the time to extract all the numbers.  Also, because the data is searched based, it would more difficult to find the names of people you don’t know and aren’t specifically looking for.

The basic technology behind our concept is that when you text a particular keyword to a particular phone number, the message gets forwarded to a php script.  This script processes your text and performs a small set of functions like looking up a name, adding a name, or editing a name.  Special characters like  @ and ! are used to activate these various modes.

We have prototyped this concept and it is working.  We have some special cases to design around and debug, like if someone sends an empty message, includes more than one special character, or somehow alters the incoming message to be otherwise undesirable.

We hope to launch this into the wild this week and look forward to getting people’s feedback.

Link to the dynamic php file.  Link to the source code as text.

Info Visualization Concepts (9/20/2010)

3 Places to get pre-formatted data:

A. Carnegie Mellon University Phonetic Dictionary

B. Central Park Weather Data

C. Yahoo Finance stock market data

Ideas of how to gather data:

1. Scrape data from the ITP list-serve, using the google group API.  Store data as (id, date, from, conversation_members, subject, number_of_posts)

2. Scrape data from Dictionary.com to supplement the CMU phonetic dictionary to include parts of speech.

3. Scrape McMaster Carr for all parts that they have 3d files for.

4. Put an accelerometer in all 4 elevator bays in my apt building, recording usage patterns.  Store data as (id, date_time, z_accel, accel_length, floor)

5. Put a hallway webcam in the peephole of my door.  Any time the image is moving, record date-time.  Any time the image stops moving, record date-time.  Cross reference time stamps with video footage logs.

6. Install a motion sensor, seismic sensor, and microphone on a subway platform.  Record amount of traffic.  Compare scheduled train times with actual times.  Flag times when decibel level is enough to cause hearing loss.

7. Wikipedia.  Crawl all articles and follow all links.  Assign a weight to each page for accuracy, dependent on how many refs are external from wikipedia.  Record how many unique contributors there are.  Record frequency of edits.

SMS App Concepts (9/14/2010)
  1. One-Time Password SMS-based security system.  Rig a solenoid to a lock and text the correct password to unlock remotely.
  2. ITP phone directory – Access an online phone directory by texting a search query with part of all of someone’s name.  Receive all matching contacts via text.
  3. Password Manager – remember your locker combinations, bank account numbers, email passwords and more.  Simply text a search query, authenticate from your unique phone number, and get your passwords texted back to you.
  4. Text me my class schedule – text your NYU netID number and receive back your class schedule, for that day or that week.
  5. Calendar Reminders – sync your calendar to a database and receive reminders for important appointments via text.
  6. NYC scavenger hunt event – follow clues to various locations where you uncover authentication codes.  Text in the codes to receive the next clue.
  7. Inspirational quotes – hundreds of inspirational quotes are stored and individual quotes are sent to subscribers at random times of the day.
  8. I think you’re rad – I think you’re hot: text a middleman about people at ITP who you are interested in connecting with or intimately connecting with.  If you are mutually interested, the texts go through to each other.
Cinder Exploration – Vector Grass (9/11/2010)

Here’s a video and Mac Application for a Cinder project I’ve been playing around with. It’s a modification to Robert Hodgin’s ‘Hello Cinder’ tutorial.

Cinder Study – Vector Grass

DOWNLOAD the APP for OSX