Project Overview
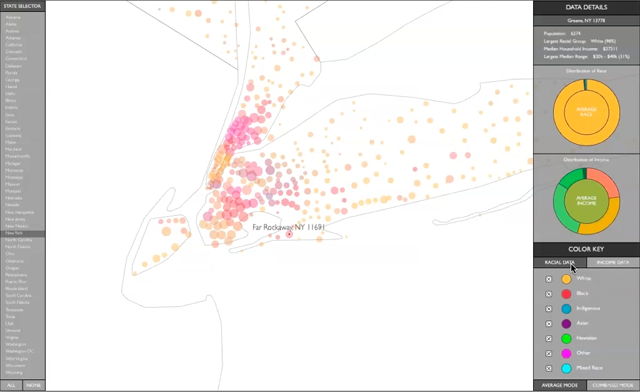
Visual Concensus is a data visualization project which looks at the 2000 US Census data. By plotting individual zip codes as colored circles on a map, users are engaged with the information before them and can easily spot patterns. The data focuses on population size, ethnicity, and houeshold income.

The project was coded in C++ and Cinder and is currently available as a stand-alone application for Mac OSX. Users can pan and zoom around on the map to investigate various areas, and can toggle numerous filters to focus on particular regions and demographics.
Video Demonstration
Project Download
This project is available for download at this link.


