Project Overview
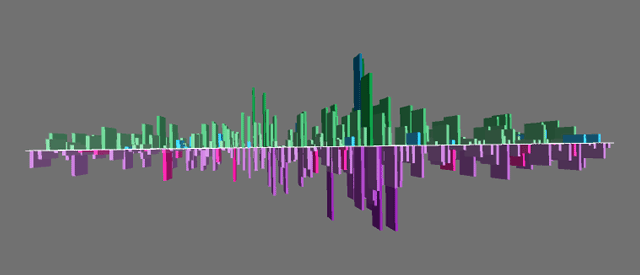
Building on the works of Wassily Kandinsky and Oskar Fischinger, this project explores visualizing sound as individual colored notes in an organized spiral form. The project began with the discovery of the spiral form, and was developed into a screen based interactive program and physically controlled interactive table-top device.
Part 1 – Discovery of the Spiral Form
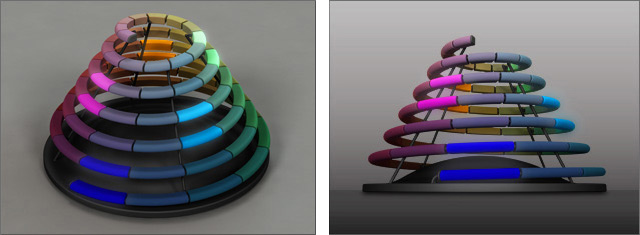
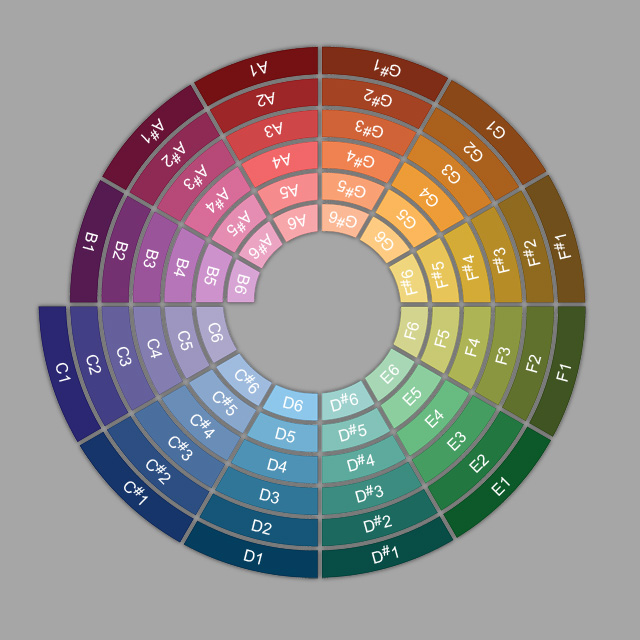
While trying to find a way to optimally visualize the relationships between musical notes, the discovery was made of a spiral arrangement; not only did the spiral represent the tonal changes between adjacent notes, but it also revealed the relationship between the same note in different octaves.
Part 2 – Sound Spiral Animation
A hypothesis was made that harmonic music would create visual geometric patterns such as triangles and squares within the sound spiral. To explore this, Beethoven’s Moonlight Sonata was digitally encoded and accompanied by an animation in which each note was illuminated at the same moment it was heard.
Part 3 – Interactive Program
A live interactive version of the sound spiral was created using Processing.
Watch a video that demonstrates the program, or follow the link to the actual program.
Link to the LIVE INTERACTIVE PROGRAM.
Part 4 – Interactive Physical Prototype
A physical prototype of the sound spiral was built using the Arduino platform. An array of reed switches were used to activate each individual note, and a magnetic wand was implemented to trigger each switch. The signals were sent from the Arduino to the Processing program, allowing a user to play the sound spiral with their hands, rather than just the mouse.
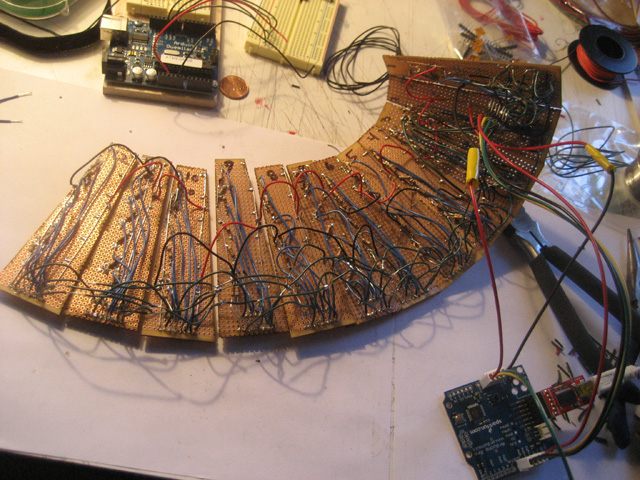
12 individual panels were custom made and hand soldered.
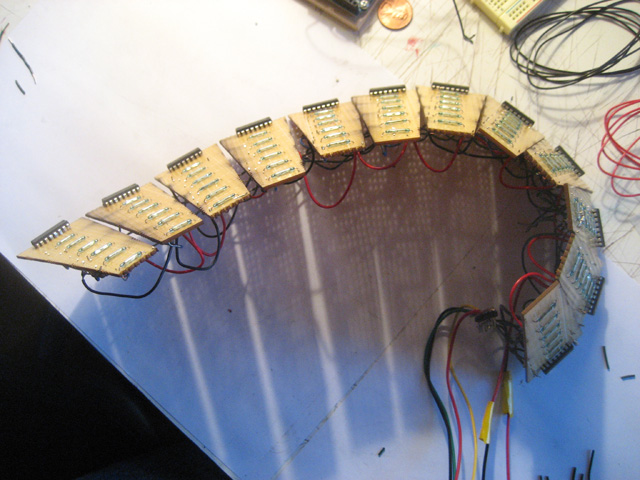
The panels were assembled together into the spiral form.
Video Demonstration of the device connected to a laptop running the Processing sketch.
Video Demonstration of chord mode and wand interface.
