Data Parsing with Processing – Part 1 (9/27/2010)

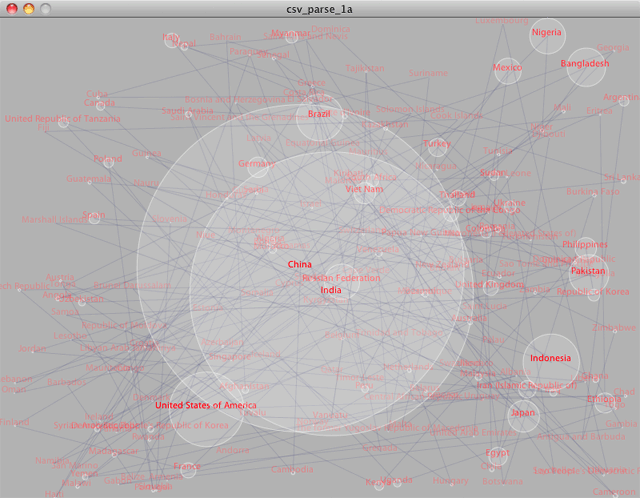
For the week 2 assignment in Expression Frameworks, I’ve taken the population of all the world’s countries and plugged it into a Processing sketch.
First, the comma-seperated-value data file was split into lines; next, the individual values for country name and population amount were extracted; and finally these values were stored into Objects for display and manipulation.
My Processing coding is a little rusty, so I thought I’d visualize each country as a bouncing ball, where the diameter was related to the population size. In a loosely haphazard way, the balls bounce to and fro and are interconnected with lines. I’d love for the visual variables to directly correlate with the data variables and for there to be additional cross-referencing data values (like GDP, etc), so I’m looking forward to developing this further into a true data visualization.
For now, I’m feeling more comfortable with my Processing syntax and getting even more excited about this class.
Link to the Data Source. Link to the Code. Link to the Live Processing Sketch.