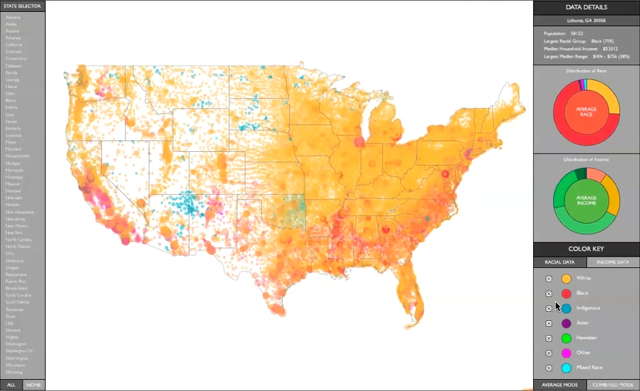
Visual ConCensus – US Census DataViz (12/20/2010)

A final version of my US Census data visualization project is finished and has been on display at NYU’s ITP Winter Show. The project visualizes racial and income data across the United States by coloring individual zip codes and plotting them on a map. A configurable user interface allows users to toggle on and off a series of filters, focusing on individual states or particular demographics. Within the data lie a multitude of stories, all of which are there for the user to discover and be provoked by.
Link to watch a video demonstration of the application.
Link to download the application (supports Mac OSX 10.5 or higher).